EQ display
> The EQ display is the primary canvas of Outboard-EQ. It shows the live spectrum, the combined EQ curve, the eight band discs, and any overlays you've enabled. Everything you draw on it is also autom
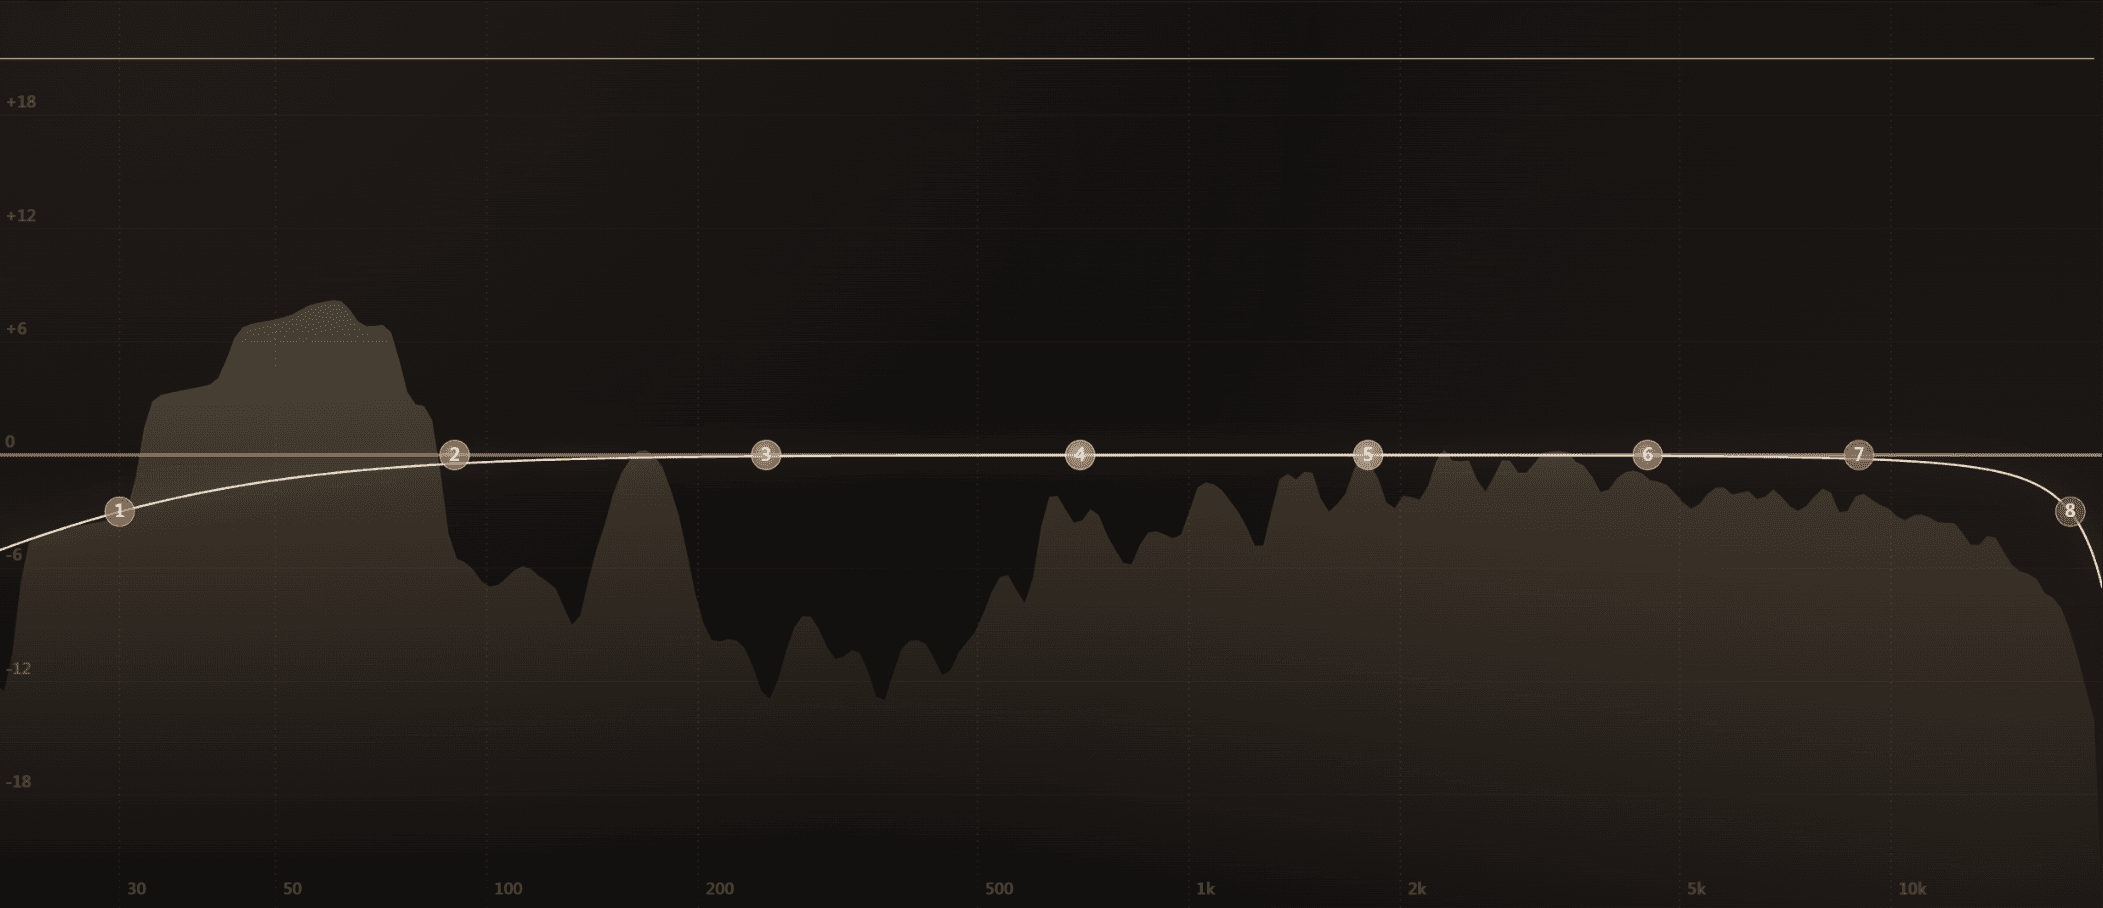
The EQ display is the primary canvas of Outboard-EQ. It shows the live spectrum, the combined EQ curve, the eight band discs, and any overlays you've enabled. Everything you draw on it is also automated and recall-safe in your DAW.
The curve
The dark solid line is the summed EQ curve of all active bands at their current frequency, gain, Q, type, and slope. The math behind the curve is identical to the DSP that processes the audio (RBJ Audio EQ Cookbook biquads, direct-form-II-transposed), so what you see is exactly what you hear.
The spectrum
The translucent fill behind the curve is the post-EQ spectrum by default. Two more taps are available from the Overlays menu:
- Pre — the signal before any EQ. Useful for comparing what you've added or removed.
- External — either the plugin's sidechain input or another Outboard-EQ instance's post-tap, served via the cross-instance Spectrum Broker.
See Spectrum analyzer for FFT size, smoothing, tilt, and peak-hold controls.
Band discs
Each of the eight bands has a coloured disc on the curve. The disc carries the band's number, its filter type icon, and a small Dyn indicator that flashes when the dynamic stage is reducing or boosting gain.
- Drag the disc to move freq + gain at once.
- Scroll on the disc to change Q.
- Double-click to solo / un-solo (see Solo).
- Right-click for filter type, slope, M/S routing, channel mask, and the stage cards.
Y-range buttons
Top-right of the display: ±3 / ±6 / ±12 / ±24 dB. Pick the range that suits the work — ±24 dB for mastering where every move is small, ±3 dB for fine surgical decisions. The choice is remembered per host.
Grid and piano
- Grid toggle — overlay 1-octave vertical lines and 6 dB horizontal lines.
- Piano strip — a keyboard at the bottom of the canvas that highlights the note nearest each band's centre frequency. Footer pill toggles it.
Overlays
- Hardware overlay — when bands have an Op-Amp or Tape stage active, a coloured RMS-driven glow sits behind the disc to remind you which character is engaged. See Hardware character.
- Density overlay — translucent vertical columns indicate the Pre or Post density tap on each band. See Density stage.
Tips
- Click an empty area of the display to add a band at exactly the position you click — the filter type is chosen by zone (LowCut at the left, HighCut at the right, Peak in the middle).
- The ±24 dB Y range plus pinned spectrum makes a great mastering reference view even when you've added no bands yet.
- Hold F11 or click the Full-View pill in the footer to stretch the canvas across the whole window; the choice is saved per host.
See also
Knobs and interaction
> Every knob, disc, and switch in Outboard-EQ responds to the same set of gestures, so once you've learned them on the EQ display, the stage cards and global controls behave the same way.
Band controls
> Each of the eight bands has the same set of static controls — frequency, gain, Q, filter type, slope, on/off, and routing. Everything else (dynamics and the per-band character stages) layers on top